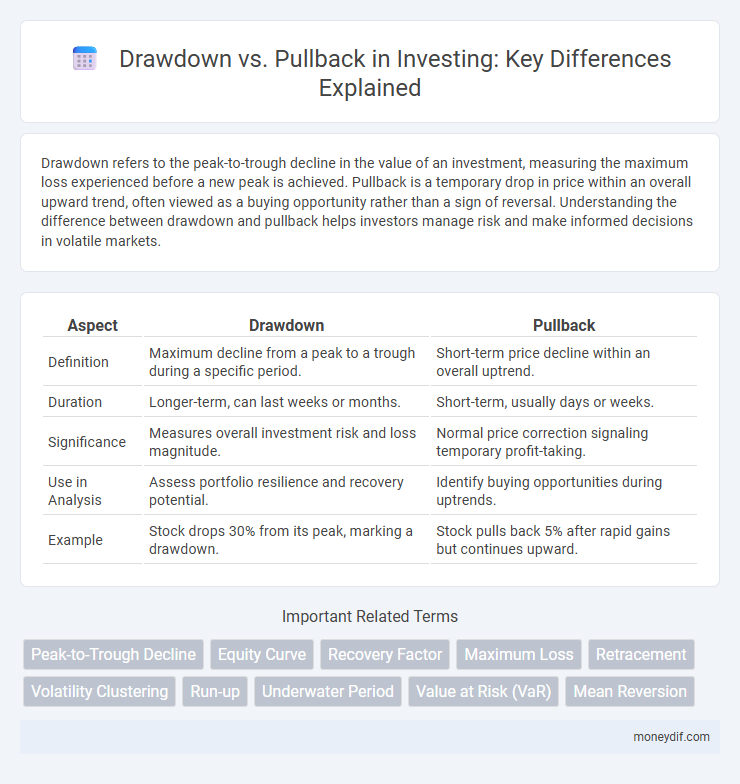
Drawdown refers to the peak-to-trough decline in the value of an investment, measuring the maximum loss experienced before a new peak is achieved. Pullback is a temporary drop in price within an overall upward trend, often viewed as a buying opportunity rather than a sign of reversal. Understanding the difference between drawdown and pullback helps investors manage risk and make informed decisions in volatile markets.
Table of Comparison
| Aspect | Drawdown | Pullback |
|---|---|---|
| Definition | Maximum decline from a peak to a trough during a specific period. | Short-term price decline within an overall uptrend. |
| Duration | Longer-term, can last weeks or months. | Short-term, usually days or weeks. |
| Significance | Measures overall investment risk and loss magnitude. | Normal price correction signaling temporary profit-taking. |
| Use in Analysis | Assess portfolio resilience and recovery potential. | Identify buying opportunities during uptrends. |
| Example | Stock drops 30% from its peak, marking a drawdown. | Stock pulls back 5% after rapid gains but continues upward. |
Understanding Drawdown and Pullback in Investment
Drawdown in investment measures the peak-to-trough decline during a specific period, reflecting the maximum loss an investor might face before recovery. A pullback, however, refers to a temporary reverse movement within an overall upward trend, often viewed as a short-term price correction rather than a lasting decline. Understanding the distinction between drawdown and pullback helps investors manage risk and make informed decisions during market fluctuations.
Key Differences Between Drawdown and Pullback
Drawdown represents the peak-to-trough decline in an investment's value, measuring the maximum loss experienced over a specific period, while a pullback refers to a temporary price reversal within an ongoing uptrend or downtrend. Drawdowns quantify overall risk and capital erosion, crucial for risk management and assessing investment resilience, whereas pullbacks signal short-term corrections or profit-taking opportunities, often seen as entry points for investors. Understanding these distinctions aids in portfolio strategy, with drawdowns influencing long-term risk tolerance and pullbacks guiding tactical trading decisions.
Why Drawdowns Matter to Investors
Drawdowns represent the peak-to-trough decline in an investment portfolio's value, signaling the maximum loss an investor could experience during a specific period. Understanding drawdowns is crucial because they measure risk exposure and the portfolio's ability to recover, directly impacting an investor's capital preservation and psychological resilience. Unlike pullbacks, which are temporary and less severe price dips, drawdowns highlight fundamental vulnerabilities in investment strategies that require careful management to avoid significant financial setbacks.
Identifying Pullbacks in Market Trends
Pullbacks in market trends represent temporary price declines within an overall upward movement, often signaling buying opportunities as they indicate healthy market corrections rather than full reversals. Identifying pullbacks involves analyzing price action relative to moving averages and support levels, where moderate declines often find support before resuming the primary trend. Distinguishing pullbacks from drawdowns, which are larger-scale declines from peak to trough, is crucial for investors to avoid premature selling during normal market fluctuations.
Measuring Drawdown in Your Portfolio
Measuring drawdown in your portfolio involves assessing the peak-to-trough decline during a specific period to quantify potential losses. This metric reflects the maximum drop from an investment's previous high, providing insight into risk exposure and capital preservation. Accurate drawdown measurement helps investors adjust strategies to mitigate losses and optimize long-term returns.
Pullback as a Short-Term Market Movement
Pullback refers to a short-term decline in asset prices within an overall uptrend, typically lasting days to weeks. Unlike a drawdown, which measures the peak-to-trough decline from an investment's highest point, pullbacks present potential buying opportunities during temporary market corrections. Traders often use technical indicators like moving averages and support levels to identify pullbacks and optimize entry points in trending markets.
Risk Management Strategies for Drawdowns
Drawdown refers to the peak-to-trough decline in an investment portfolio's value, highlighting the maximum loss experienced, while a pullback represents a temporary price drop within an overall uptrend. Effective risk management strategies for drawdowns include setting stop-loss orders, diversifying assets, and implementing position sizing to limit exposure. Monitoring drawdown metrics helps investors adjust portfolios proactively to preserve capital and maintain long-term growth potential.
How Pullbacks Can Present Buying Opportunities
Pullbacks represent temporary declines within an overall upward trend, offering strategic entry points for investors to accumulate shares at lower prices without abandoning the long-term growth trajectory. Unlike drawdowns, which signify more severe portfolio value drops, pullbacks often reflect healthy market corrections that can enhance investment returns when timed correctly. Identifying pullbacks through technical indicators such as moving averages or support levels allows investors to capitalize on price dips amidst prevailing bullish momentum.
Drawdown vs Pullback: Impact on Investment Decisions
Drawdown measures the peak-to-trough decline in an investment's value, reflecting the maximum loss experienced, while pullback represents a short-term price dip within an ongoing uptrend. Understanding drawdown severity helps investors assess risk tolerance and adjust portfolio allocation to prevent significant capital erosion. Pullback analysis aids in timing entry points without misinterpreting temporary market corrections as long-term downturns.
Mitigating Losses During Drawdowns and Pullbacks
Mitigating losses during drawdowns and pullbacks requires implementing strict risk management techniques such as setting stop-loss orders and diversifying portfolios across asset classes. Investors should monitor volatility indicators and adjust position sizes to minimize exposure during sharp market declines. Employing hedging strategies like options or inverse ETFs can also protect capital while preserving upside potential during recovery phases.
Important Terms
Peak-to-Trough Decline
Peak-to-trough decline measures the total percentage loss from an asset's highest point (peak) to its lowest point (trough), representing a drawdown, whereas a pullback is a temporary price decline within an overall upward trend.
Equity Curve
The equity curve visually tracks portfolio value over time, with drawdown measuring peak-to-trough declines and pullback indicating temporary price reversals within an upward trend.
Recovery Factor
The Recovery Factor measures the efficiency of recovering losses by comparing the total net profit to the maximum drawdown, while pullback refers to a temporary price reversal within an overall trend.
Maximum Loss
Maximum Loss quantifies the greatest peak-to-trough drawdown in asset value, representing a more severe and prolonged decline than a pullback, which typically indicates a short-term price reversal within an overall uptrend.
Retracement
Retracement refers to a temporary price reversal within a prevailing trend, distinguished from a drawdown that measures peak-to-trough decline in investment value and a pullback representing a short-term drop often seen as a buying opportunity.
Volatility Clustering
Volatility clustering in financial markets often causes extended drawdowns followed by smaller, frequent pullbacks, highlighting periods of persistent high volatility.
Run-up
Run-up refers to the price increase leading to a peak before a drawdown, which measures the decline from that peak, while a pullback is a temporary drop within an ongoing upward trend.
Underwater Period
The underwater period measures the duration between a portfolio's peak value and the recovery to that peak during drawdown and pullback phases in investment performance analysis.
Value at Risk (VaR)
Value at Risk (VaR) quantifies potential portfolio losses within a specified timeframe, differentiating from drawdown which measures peak-to-trough declines, and pullback which represents shorter-term price reversals within an overall uptrend.
Mean Reversion
Mean reversion strategies often identify pullbacks as temporary price declines within an overall trend, whereas drawdowns represent larger, more persistent losses that signal a potential trend reversal.
Drawdown vs Pullback Infographic