Drawdown measures the peak-to-trough decline in an investment's value, reflecting the actual loss experienced by investors during market downturns. Volatility quantifies the degree of price fluctuations over time, often expressed as standard deviation, indicating the investment's risk level. Understanding the distinction between drawdown and volatility helps investors assess downside risk sensitivity versus overall price variability when making allocation decisions.
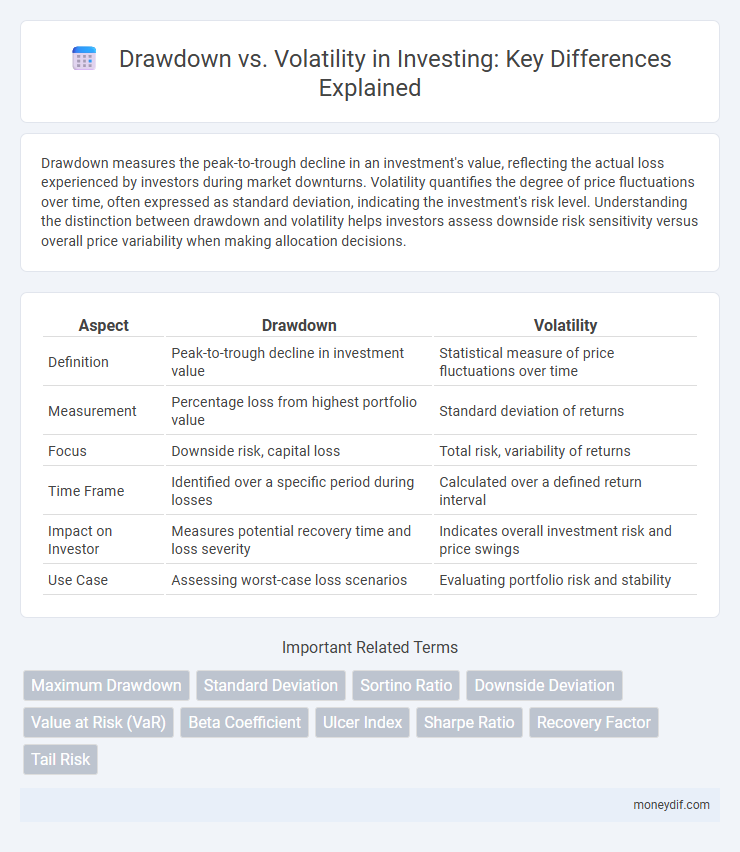
Table of Comparison
| Aspect | Drawdown | Volatility |
|---|---|---|
| Definition | Peak-to-trough decline in investment value | Statistical measure of price fluctuations over time |
| Measurement | Percentage loss from highest portfolio value | Standard deviation of returns |
| Focus | Downside risk, capital loss | Total risk, variability of returns |
| Time Frame | Identified over a specific period during losses | Calculated over a defined return interval |
| Impact on Investor | Measures potential recovery time and loss severity | Indicates overall investment risk and price swings |
| Use Case | Assessing worst-case loss scenarios | Evaluating portfolio risk and stability |
Understanding Drawdown: A Key Investment Metric
Drawdown measures the peak-to-trough decline in an investment's value, providing a clear indicator of potential losses during market downturns. Unlike volatility, which captures overall price fluctuations, drawdown specifically highlights the worst-case loss an investor might face. Understanding drawdown helps investors assess risk tolerance and make informed decisions to protect capital during adverse market conditions.
Volatility Explained: What Every Investor Should Know
Volatility measures the degree of variation in an asset's price over time, reflecting the speed and magnitude of market fluctuations that investors face. While drawdown represents the peak-to-trough decline in portfolio value, volatility provides a broader view of risk by capturing short-term price movements and market uncertainty. Understanding volatility is crucial for investors to gauge potential risks, set appropriate investment horizons, and optimize asset allocation strategies.
Drawdown vs Volatility: Core Differences Unveiled
Drawdown measures the peak-to-trough decline in an investment's value, reflecting the maximum loss an investor can endure, whereas volatility quantifies the overall price fluctuations over time. Drawdown highlights risk in terms of capital preservation, providing insight into downside risk severity, while volatility captures the variability of returns without distinguishing between upside and downside movements. Understanding these core differences enables investors to assess risk tolerance more accurately and tailor portfolio strategies accordingly.
Measuring Drawdown: Tools and Techniques
Measuring drawdown involves quantifying the peak-to-trough decline in portfolio value to assess investment risk and recovery time. Tools like maximum drawdown (MaxDD), rolling drawdown, and drawdown duration metrics help investors identify historical loss severity and frequency. Techniques such as Monte Carlo simulations and stress testing provide probabilistic insights into potential future drawdowns, enhancing portfolio risk management strategies.
Assessing Volatility: Common Methods and Metrics
Assessing volatility in investment portfolios involves analyzing statistical measures like standard deviation, beta, and the VIX index to quantify price fluctuations over time. Drawdown, representing the peak-to-trough decline, highlights potential loss magnitude but does not capture the frequency or variance of returns, which volatility metrics address. Common methods include calculating moving averages and using historical price data to evaluate market risk and inform strategic asset allocation decisions.
Impact of Drawdown on Portfolio Performance
Drawdown represents the peak-to-trough decline in a portfolio's value, directly affecting investor confidence and risk tolerance. Larger drawdowns often result in prolonged recovery times, which can diminish cumulative returns and hinder compounding growth. Managing drawdown effectively is crucial for maintaining portfolio stability and achieving long-term investment objectives.
How Volatility Affects Investment Returns
Volatility refers to the degree of variation in asset prices over time, directly impacting investment returns by increasing uncertainty and potential risk. Higher volatility can lead to significant drawdowns, which are peak-to-trough declines in portfolio value, amplifying the challenge of recovering losses. Understanding volatility metrics like standard deviation and beta helps investors gauge the risk-return profile and manage portfolio allocations effectively to optimize growth and minimize drawdowns.
Managing Drawdown Risk in Your Investments
Managing drawdown risk in investments involves closely monitoring the peak-to-trough decline in portfolio value to prevent substantial capital losses. Unlike volatility, which measures short-term price fluctuations, drawdown assesses the actual loss experienced, making it critical for long-term investment resilience. Employing strategies such as diversification, stop-loss orders, and risk-adjusted asset allocation can effectively minimize drawdown exposure and preserve investment capital.
Strategies to Mitigate Volatility in Portfolios
Effective strategies to mitigate volatility in portfolios include diversification across asset classes, sectors, and geographies, which reduces exposure to market-specific risks and smooths returns. Utilizing low-volatility or minimum variance funds can further stabilize portfolio value by focusing on securities with historically lower price fluctuations. Incorporating alternative investments like real estate or hedge funds offers independent return streams that often exhibit low correlation with traditional equities and bonds, thereby minimizing overall portfolio drawdown during market downturns.
Choosing the Right Metric: Drawdown or Volatility for Decision Making
Drawdown measures the peak-to-trough decline in an investment's value, offering a clear picture of potential losses during market downturns, while volatility quantifies the overall price fluctuations, reflecting risk through standard deviation. Investors prioritizing capital preservation often rely on drawdown to assess downside risk, whereas those focused on portfolio diversification and risk-adjusted returns may prefer volatility as a broader risk metric. Choosing the right metric depends on individual risk tolerance, investment horizon, and the specific financial goals guiding the decision-making process.
Important Terms
Maximum Drawdown
Maximum Drawdown quantifies the largest peak-to-trough loss in an investment portfolio, serving as a critical risk metric by measuring the worst-case capital erosion. Unlike volatility, which captures overall price fluctuations, Maximum Drawdown specifically highlights sustained declines, providing a more precise indicator of potential downside risk during market downturns.
Standard Deviation
Standard deviation measures the overall volatility of an investment's returns, quantifying how much those returns deviate from the average. Drawdown specifically focuses on the peak-to-trough decline, highlighting the investment's downside risk and recovery time in relation to volatility metrics.
Sortino Ratio
The Sortino Ratio measures risk-adjusted return by focusing on downside volatility rather than total volatility, distinguishing itself from the Sharpe Ratio which considers both upside and downside volatility. By prioritizing drawdown risk, the Sortino Ratio provides a more accurate assessment of a portfolio's performance during periods of negative returns, making it a preferred metric for investors concerned with downside risk management.
Downside Deviation
Downside deviation specifically measures the volatility of negative returns, providing a more focused risk metric compared to traditional volatility that considers both upside and downside fluctuations. Drawdown quantifies the peak-to-trough decline in investment value, complementing downside deviation by highlighting the severity and duration of losses within a portfolio.
Value at Risk (VaR)
Value at Risk (VaR) quantifies the potential loss in portfolio value over a defined period for a given confidence interval, capturing downside risk more effectively than volatility, which measures overall price variability without distinguishing between gains and losses. Drawdown specifically tracks the peak-to-trough decline during a portfolio's investment horizon, providing a direct measure of realized losses that complements VaR's probabilistic loss estimates.
Beta Coefficient
The Beta Coefficient measures a portfolio's sensitivity to market movements, indicating how its drawdown correlates with overall market volatility. Higher beta values suggest greater potential drawdowns during market downturns, reflecting increased exposure to systematic risk compared to volatility levels.
Ulcer Index
The Ulcer Index measures investment risk by quantifying drawdown severity and duration, emphasizing downside volatility rather than overall volatility. It provides a more accurate assessment of investor stress compared to standard deviation by focusing solely on downside price movements and prolonged declines.
Sharpe Ratio
The Sharpe Ratio measures risk-adjusted return by comparing portfolio returns above the risk-free rate to the portfolio's volatility, capturing overall variability rather than downside risk. Drawdown reflects maximum peak-to-trough losses and highlights downside risk, which traditional Sharpe Ratio calculations may overlook, prompting the use of modified metrics like the Sortino Ratio for better downside risk assessment.
Recovery Factor
Recovery Factor measures the ability to regain lost capital by comparing cumulative returns to the maximum drawdown experienced, serving as an essential metric for evaluating investment resilience. Unlike volatility, which quantifies overall price fluctuations, Recovery Factor focuses on the efficiency of capital restoration after significant drawdowns, highlighting risk-adjusted performance and capital preservation strategies.
Tail Risk
Tail risk refers to the probability of extreme portfolio losses occurring beyond standard deviation expectations, directly impacting drawdown severity rather than average volatility measures. Drawdown captures persistent capital decline during tail events, while volatility measures the dispersion of returns and often underestimates tail risk magnitude in financial markets.
Drawdown vs Volatility Infographic