Drawdown measures the peak-to-trough decline in a trading account, reflecting the largest loss endured before recovery, while retracement indicates a temporary price reversal within an overall trend. Understanding the difference helps traders identify whether a price movement signals a potential trend change or a brief pullback. Managing drawdown risk is crucial for preserving capital, whereas recognizing retracements aids in optimizing entry and exit points within a prevailing trend.
Table of Comparison
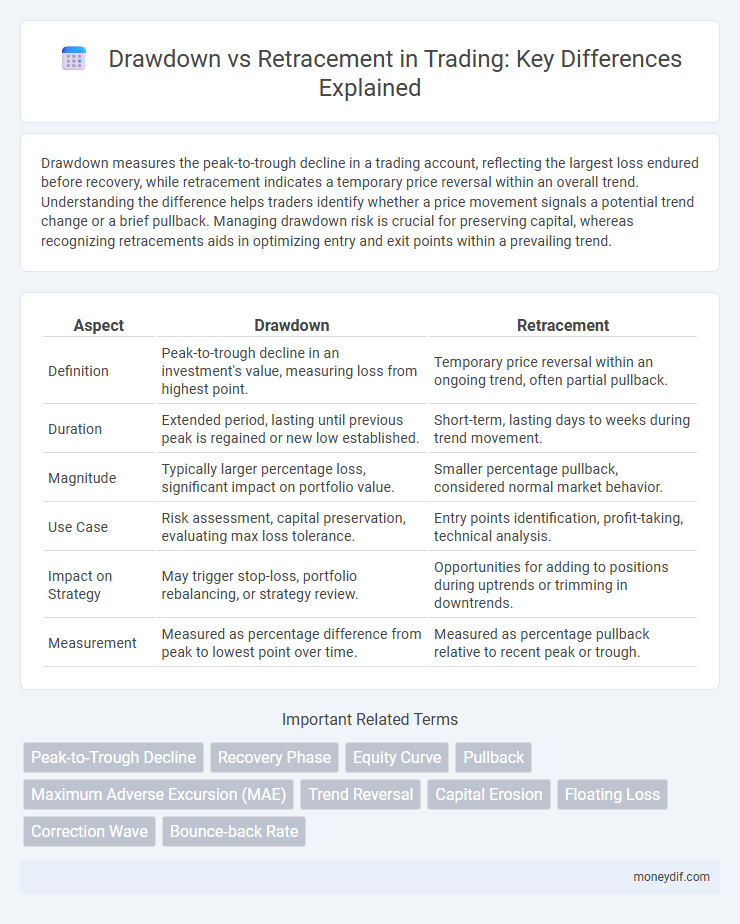
| Aspect | Drawdown | Retracement |
|---|---|---|
| Definition | Peak-to-trough decline in an investment's value, measuring loss from highest point. | Temporary price reversal within an ongoing trend, often partial pullback. |
| Duration | Extended period, lasting until previous peak is regained or new low established. | Short-term, lasting days to weeks during trend movement. |
| Magnitude | Typically larger percentage loss, significant impact on portfolio value. | Smaller percentage pullback, considered normal market behavior. |
| Use Case | Risk assessment, capital preservation, evaluating max loss tolerance. | Entry points identification, profit-taking, technical analysis. |
| Impact on Strategy | May trigger stop-loss, portfolio rebalancing, or strategy review. | Opportunities for adding to positions during uptrends or trimming in downtrends. |
| Measurement | Measured as percentage difference from peak to lowest point over time. | Measured as percentage pullback relative to recent peak or trough. |
Understanding Drawdown in Trading
Drawdown in trading measures the peak-to-trough decline in an investment portfolio, indicating the percentage loss from its highest value to the subsequent low before a new peak is achieved. It quantifies the risk and potential loss investors face during adverse market movements, serving as a critical metric for assessing trading strategy durability. Unlike retracement, which refers to a temporary reversal within an overall uptrend or downtrend, drawdown reflects cumulative capital reduction, crucial for risk management and psychological resilience in trading.
Defining Retracement in Market Analysis
Retracement in market analysis refers to a temporary reversal in the price of a financial asset, moving counter to the prevailing trend before resuming its original direction. It represents a short-term pullback within a larger trend and is not indicative of a complete trend reversal. Traders use retracements to identify potential entry points during upward or downward trends by analyzing price corrections through tools like Fibonacci retracement levels.
Key Differences Between Drawdown and Retracement
Drawdown represents the peak-to-trough decline during a specific period in a trading account, measuring the maximum loss from a historical high, while retracement refers to a temporary price pullback within an overall upward or downward trend. Drawdowns impact long-term portfolio risk assessment and capital preservation strategies, whereas retracements are utilized to identify strategic entry points and confirm trend continuations. Understanding these distinctions is crucial for effective risk management and optimizing trade timing in market analysis.
Causes of Drawdowns in Trading Strategies
Drawdowns in trading strategies primarily result from market volatility, poor risk management, and emotional decision-making that leads to premature exits or excessive losses. Unexpected news events or economic shifts can trigger sharp price movements, causing significant drawdowns beyond typical retracements. Traders who fail to adapt to changing market conditions or who over-leverage positions increase their risk exposure, amplifying the severity of drawdowns.
Identifying Retracement Patterns
Retracement patterns in trading often signal a temporary reversal against the prevailing trend, typically identified through Fibonacci retracement levels and moving average bounces. Recognizing these patterns allows traders to distinguish between minor pullbacks and significant drawdowns, minimizing premature exits from profitable positions. Candlestick formations such as Doji, Hammer, or Engulfing patterns combined with volume analysis enhance the accuracy of retracement identification.
Impact of Drawdown on Portfolio Performance
Drawdown measures the peak-to-trough decline in a trading portfolio, directly impacting overall performance by reducing capital available for future trades and increasing the risk of margin calls. Unlike retracements, which are temporary price pullbacks within an uptrend, drawdowns reflect sustained losses that erode investor confidence and compound recovery time. Managing drawdown levels is crucial for preserving capital, maintaining liquidity, and achieving long-term growth in portfolio value.
How Traders Manage Retracements
Traders manage retracements by identifying key support and resistance levels to distinguish them from more severe drawdowns, using technical indicators like Fibonacci retracement levels to time entry and exit points. Effective risk management includes adjusting position sizes and setting stop-loss orders to protect capital during temporary price pullbacks. Recognizing that retracements are normal market corrections helps traders maintain discipline and avoid premature liquidation of positions.
Tools for Measuring Drawdown and Retracement
Drawdown measurement tools primarily include peak-to-trough analysis, where the maximum loss from a portfolio's highest value to its lowest point is quantified using percentage calculations or absolute dollar amounts. Retracement tools often rely on Fibonacci retracement levels and moving averages to identify temporary price reversals within an overall trend, aiding traders in pinpointing entry and exit points. Advanced platforms integrate real-time analytics and customizable indicators, enhancing accuracy in distinguishing between drawdowns and retracements for risk management and strategy optimization.
Drawdown vs Retracement: Practical Examples
A drawdown represents the peak-to-trough decline in a trading account's equity, highlighting the maximum loss endured before recovery, essential for risk management assessment. A retracement, in contrast, is a temporary price reversal within an ongoing trend, often viewed as a buying opportunity rather than a signal of a trend reversal. For example, a trader experiencing a 15% drawdown means their account equity dropped 15% from its peak, whereas a 5% retracement in a bullish trend may provide an entry point without indicating significant capital loss.
Best Practices to Mitigate Drawdown and Retracement Risks
Implement strict risk management techniques such as setting stop-loss orders and position sizing to limit drawdown exposure during volatile market conditions. Regularly analyze price retracements using Fibonacci levels and trendlines to identify potential entry points while avoiding premature exits. Diversify trading strategies and assets to reduce correlation risk and enhance overall portfolio resilience against significant drawdowns and retracements.
Important Terms
Peak-to-Trough Decline
Peak-to-Trough decline measures the maximum drawdown from a peak to its lowest trough, distinguishing it from retracement, which refers to temporary price reversals within a broader trend.
Recovery Phase
The Recovery Phase occurs when asset prices rise after a drawdown, with retracement measuring the temporary price pullbacks within this upward trend.
Equity Curve
Equity curve analysis highlights drawdown as the peak-to-trough decline during a trading period, while retracement represents a temporary price reversal within an overall trend.
Pullback
A pullback is a temporary price decline within an overall uptrend that often serves as a retracement, whereas a drawdown measures the peak-to-trough decline from the highest value over a specific period.
Maximum Adverse Excursion (MAE)
Maximum Adverse Excursion (MAE) quantifies the largest peak-to-trough drawdown during a trade, differentiating it from retracement by measuring maximum unrealized loss rather than partial price reversals.
Trend Reversal
Trend reversal often occurs after a significant drawdown surpasses typical retracement levels, signaling a shift in market direction.
Capital Erosion
Capital erosion occurs when drawdown, the peak-to-trough decline in an investment's value, exceeds normal retracement levels, leading to a permanent loss of equity rather than a temporary price pullback.
Floating Loss
Floating loss represents the unrealized loss during a drawdown, indicating the decline from peak equity before any retracement or recovery occurs.
Correction Wave
Correction waves represent temporary price reversals within a prevailing trend that can be quantified by measuring drawdown, the peak-to-trough decline, versus retracement, the partial reversal of a prior move expressed as a percentage.
Bounce-back Rate
Bounce-back rate measures the speed and extent of a price recovery following a drawdown, distinguishing it from a retracement that represents a temporary reversal within the prevailing trend.
Drawdown vs Retracement Infographic