Support represents a price level where buying interest is strong enough to prevent the asset from falling further, acting as a floor in trading charts. Resistance is the opposite, marking a price point where selling pressure outweighs buying, creating a ceiling that halts upward momentum. Understanding support and resistance levels helps traders identify potential entry and exit points, improving decision-making and risk management.
Table of Comparison
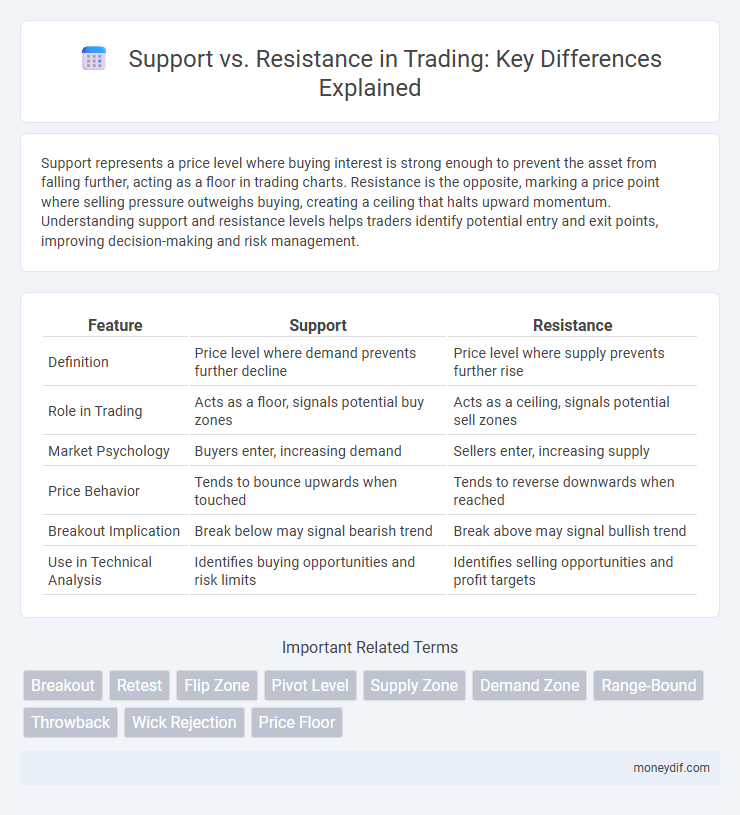
| Feature | Support | Resistance |
|---|---|---|
| Definition | Price level where demand prevents further decline | Price level where supply prevents further rise |
| Role in Trading | Acts as a floor, signals potential buy zones | Acts as a ceiling, signals potential sell zones |
| Market Psychology | Buyers enter, increasing demand | Sellers enter, increasing supply |
| Price Behavior | Tends to bounce upwards when touched | Tends to reverse downwards when reached |
| Breakout Implication | Break below may signal bearish trend | Break above may signal bullish trend |
| Use in Technical Analysis | Identifies buying opportunities and risk limits | Identifies selling opportunities and profit targets |
Understanding Support and Resistance in Trading
Support and resistance are key price levels where buying or selling pressure tends to emerge, influencing market direction. Support represents a price floor where demand overcomes supply, causing prices to bounce upward, while resistance acts as a ceiling where selling pressure exceeds buying, restricting further price increases. Recognizing these levels helps traders identify entry and exit points, manage risk, and anticipate potential market reversals effectively.
Key Differences Between Support and Resistance Levels
Support levels act as price floors where buying interest prevents further decline, while resistance levels serve as price ceilings where selling pressure limits upward movement. Support zones typically form at previous lows, signaling strong demand, whereas resistance zones emerge near previous highs, indicating strong supply. Identifying these key levels helps traders make informed decisions by anticipating potential price reversals or breakouts.
How to Identify Support Zones on a Chart
Support zones on a trading chart are identified by observing price levels where downward trends consistently pause or reverse, often marked by multiple lows at similar price points. Traders use technical tools such as horizontal trendlines drawn along these lows or moving averages that coincide with price reactions to validate support areas. Volume spikes near these levels further confirm strong buying interest, reinforcing the support zone's significance in preventing prices from falling lower.
Recognizing Resistance Levels in Price Action
Resistance levels in price action represent price points where selling pressure exceeds buying pressure, causing a price reversal or pause. Traders identify resistance by observing multiple failed attempts to break above specific price zones, often confirmed through technical indicators like volume spikes and candlestick patterns. Recognizing these levels helps in making informed decisions on potential price reversals and setting strategic entry or exit points.
Psychological Factors Behind Support and Resistance
Support and resistance levels in trading are heavily influenced by psychological factors such as trader sentiment, fear, and greed, which drive buying and selling behaviors around these price points. These levels become self-fulfilling prophecies as traders collectively perceive certain price ranges as advantageous entry or exit points, leading to increased market activity. The reinforcement of support and resistance through repeated tests solidifies their significance, impacting future price movements and trader decision-making.
The Role of Volume in Confirming Support and Resistance
Volume plays a crucial role in confirming support and resistance levels by indicating the strength and validity of price reversals. High trading volume near support points suggests strong buying interest, reinforcing the price floor, while increased volume at resistance levels signals significant selling pressure, validating the price ceiling. Traders rely on volume spikes to distinguish genuine breakouts from false signals, improving the accuracy of technical analysis in market trends.
Support vs Resistance: Which Is More Important?
Support and resistance levels serve distinct roles in trading, with support acting as a price floor where buying interest prevents further decline, while resistance functions as a ceiling where selling pressure caps upward movement. The importance of support versus resistance varies depending on market conditions and trader strategies, but support levels often hold more significance during downtrends as they indicate potential reversal points or areas for accumulation. Identifying key support areas can provide crucial entry points and risk management opportunities, whereas resistance levels help traders set profit targets and gauge market strength.
Common Mistakes When Trading Support and Resistance
Traders often mistake false breakouts for genuine trend reversals when trading support and resistance, resulting in premature entries or exits. Another frequent error is ignoring the time frame context, as support and resistance levels can vary significantly across daily, weekly, or intraday charts. Relying solely on static price levels without considering volume or market sentiment leads to misinterpreting key turning points and reduces trade accuracy.
Combining Technical Indicators with Support and Resistance
Combining technical indicators such as moving averages, RSI, or MACD with support and resistance levels enhances the accuracy of trade entries and exits by confirming price reversal or continuation signals. Support and resistance zones identify key price levels where buying or selling pressure accumulates, while technical indicators provide momentum and trend strength insights. This integrated approach reduces false breakouts and improves risk management by aligning price action with indicator-confirmed signals.
Strategies for Trading Breakouts and Reversals
Trading breakouts involves entering a position when price breaks through established support or resistance levels, signaling potential trend continuation driven by increased volume and momentum. Reversal strategies focus on identifying points where price action fails to sustain beyond support or resistance, indicating a change in trend direction validated by candlestick patterns and oscillators like RSI or MACD. Combining breakout confirmation with risk management tools such as stop-loss orders near breakout points optimizes trade entries and protects against false signals.
Important Terms
Breakout
Breakout occurs when price decisively moves above resistance or below support levels, signaling a potential trend continuation or reversal.
Retest
Retesting occurs when the price revisits a previously broken support or resistance level to confirm its validity as a new resistance or support before continuing in the breakout direction.
Flip Zone
Flip Zone represents a critical price level where former resistance turns into support, or vice versa, indicating a key reversal point in market trends.
Pivot Level
Pivot Level serves as a key technical indicator representing a potential turning point that traders use to identify critical Support and Resistance zones in financial markets.
Supply Zone
A supply zone represents a price area where selling pressure exceeds buying interest, often acting as resistance that causes price reversals in technical analysis.
Demand Zone
A Demand Zone acts as a strong support area where buying pressure exceeds selling pressure, often reversing price declines and distinguishing it from resistance zones where selling pressure dominates.
Range-Bound
Range-bound markets occur when price repeatedly oscillates between established support and resistance levels, indicating a balance of buying and selling pressure without a clear breakout.
Throwback
Throwback in trading occurs when price briefly reverses to test a previous resistance level now acting as support, confirming the strength of the support zone before continuing the trend.
Wick Rejection
Wick rejection occurs when price briefly breaches a support or resistance level but quickly reverses, indicating strong market rejection and potential trend reversal.
Price Floor
A price floor acts as a strong support level in technical analysis, preventing asset prices from falling below a certain point, while resistance levels cap upward price movement.
Support vs Resistance Infographic