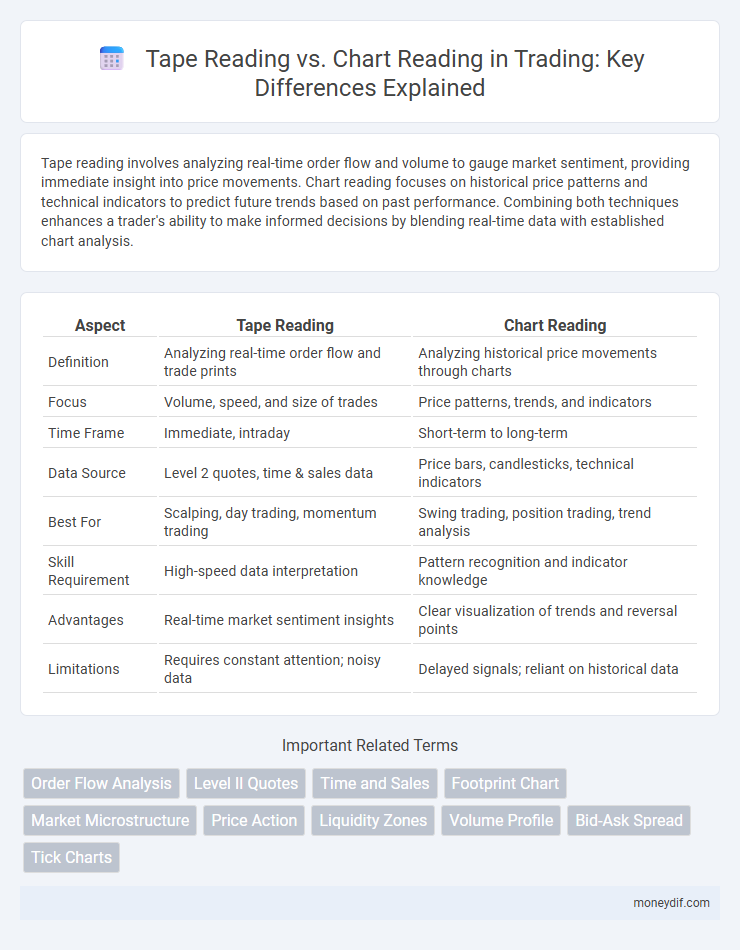
Tape reading involves analyzing real-time order flow and volume to gauge market sentiment, providing immediate insight into price movements. Chart reading focuses on historical price patterns and technical indicators to predict future trends based on past performance. Combining both techniques enhances a trader's ability to make informed decisions by blending real-time data with established chart analysis.
Table of Comparison
| Aspect | Tape Reading | Chart Reading |
|---|---|---|
| Definition | Analyzing real-time order flow and trade prints | Analyzing historical price movements through charts |
| Focus | Volume, speed, and size of trades | Price patterns, trends, and indicators |
| Time Frame | Immediate, intraday | Short-term to long-term |
| Data Source | Level 2 quotes, time & sales data | Price bars, candlesticks, technical indicators |
| Best For | Scalping, day trading, momentum trading | Swing trading, position trading, trend analysis |
| Skill Requirement | High-speed data interpretation | Pattern recognition and indicator knowledge |
| Advantages | Real-time market sentiment insights | Clear visualization of trends and reversal points |
| Limitations | Requires constant attention; noisy data | Delayed signals; reliant on historical data |
Understanding Tape Reading: Core Concepts
Tape reading involves analyzing real-time transaction data such as price, volume, and order flow from the time and sales feed to gauge market sentiment and momentum. This technique requires interpreting bid and ask sizes, trade prints, and volume spikes to identify potential price moves before they appear on traditional price charts. Mastering core tape reading concepts enhances a trader's ability to execute timely entries and exits with greater precision in fast-moving markets.
Exploring Chart Reading: Key Principles
Chart reading in trading involves analyzing price patterns, volume trends, and technical indicators to predict market movements. Key principles include understanding support and resistance levels, recognizing candlestick formations, and interpreting moving averages to identify potential entry and exit points. Mastery of these elements enables traders to make informed decisions based on market sentiment and historical price behavior.
Historical Evolution of Tape and Chart Reading
Tape reading evolved from the use of ticker tapes in the late 19th century, providing traders with real-time price and volume data through continuous printouts, which laid the foundation for modern market analysis. Chart reading developed later as graphical representations of price movements, such as bar charts and candlestick charts, became popular in the mid-20th century, allowing traders to visually identify trends and patterns over different time frames. Both methods have historically influenced trading strategies, with tape reading emphasizing real-time order flow and chart reading focusing on historical price action and technical indicators.
Advantages of Tape Reading in Modern Markets
Tape reading offers real-time insights into market sentiment by analyzing order flow and volume, enabling traders to anticipate price movements before they appear on charts. This technique provides a granular view of liquidity and trader activity, which is essential in fast-paced, high-frequency trading environments. By capturing subtle shifts in supply and demand, tape reading enhances decision-making agility and precision in modern electronic markets.
Strengths of Chart Reading for Traders
Chart reading offers traders the advantage of visualizing historical price data, revealing trends, support and resistance levels, and pattern formations crucial for making informed trading decisions. It enables the identification of market momentum and potential reversal points through technical indicators such as moving averages, RSI, and MACD. Utilizing chart reading enhances timing precision for entries and exits, improving risk management and overall trade execution efficiency.
Comparing Tape and Chart Reading Techniques
Tape reading provides real-time order flow insights by analyzing the time and sales data, enabling traders to gauge market sentiment and momentum at the micro level. Chart reading relies on historical price data and technical indicators to identify patterns and trends, supporting strategic entry and exit points based on broader market movements. Combining tape reading's granular market depth with chart reading's trend analysis enhances decision-making precision in trading strategies.
Situational Use Cases: Tape vs Chart Reading
Tape reading excels in fast-paced, high-frequency trading environments where real-time order flow and volume provide critical insights for scalping or momentum strategies. Chart reading is ideal for swing trading or longer-term positions, enabling traders to analyze historical price patterns, support and resistance levels, and technical indicators. Combining both techniques allows traders to adapt to diverse market conditions, enhancing decision-making by integrating immediate market sentiment with broader trend analysis.
Integrating Tape and Chart Reading for Strategy
Integrating tape reading with chart reading enhances trading strategy by combining real-time order flow analysis and visual price pattern recognition, enabling more precise entry and exit points. Tape reading provides granular insights into market sentiment through bid-ask dynamics and volume spikes, while chart reading offers broader trend context and technical indicators. This fusion allows traders to validate signals, improve timing, and adapt quickly to market fluctuations, boosting overall trading performance.
Common Mistakes in Tape and Chart Analysis
Common mistakes in tape reading include misinterpreting order flow speed and ignoring the context of large block trades, leading to false signals. Chart reading errors often stem from over-reliance on indicators without considering price action and market structure, causing traders to enter or exit trades prematurely. Both methods require a balanced approach to avoid confirmation bias and enhance decision accuracy in volatile markets.
Choosing the Right Approach for Your Trading Style
Tape reading provides real-time order flow and volume insights, allowing traders to make quick decisions based on market depth and liquidity. Chart reading relies on historical price patterns and technical indicators to identify trends and potential entry or exit points. Selecting the right approach depends on your trading style; scalpers and day traders may prefer tape reading for its immediacy, while swing traders and investors often benefit from the broader perspective that chart reading offers.
Important Terms
Order Flow Analysis
Order Flow Analysis leverages real-time Tape Reading to interpret market participant actions and volume dynamics more precisely than traditional Chart Reading, enhancing trading decision accuracy.
Level II Quotes
Level II quotes provide a real-time view of market depth, displaying bid and ask prices with order sizes, which is crucial for tape reading by revealing supply and demand dynamics at specific price levels. Tape reading leverages this granular Level II data to gauge market sentiment and potential price movements, whereas chart reading focuses on historical price patterns and technical indicators for trend analysis.
Time and Sales
Time and Sales provides real-time trade data essential for tape reading by showing individual transactions, while chart reading analyzes aggregated price movements and patterns over time for broader market trends.
Footprint Chart
Footprint Chart enhances tape reading by visually displaying market order flow and volume at each price level, providing more granular insights than traditional chart reading.
Market Microstructure
Market microstructure encompasses the detailed mechanisms of how trades are executed, focusing on bid-ask spreads, order flow, and liquidity dynamics. Tape reading analyzes real-time order flow and transaction prints to gauge market sentiment, while chart reading interprets historical price patterns and volume trends to predict future price movements.
Price Action
Price action analysis focuses on interpreting raw market data through tape reading to identify real-time order flow and volume, whereas chart reading primarily relies on historical price patterns and technical indicators for decision-making.
Liquidity Zones
Liquidity zones represent price areas with concentrated buy or sell orders that tape reading reveals in real-time order flow, offering more precise market entries compared to chart reading's reliance on historical price patterns.
Volume Profile
Volume Profile enhances Tape Reading by providing a visual distribution of traded volumes across price levels, complementing Chart Reading's focus on price action and patterns.
Bid-Ask Spread
The bid-ask spread reflects market liquidity and impacts tape reading by revealing real-time order flow dynamics, whereas chart reading primarily analyzes historical price patterns without directly showing current bid-ask imbalances.
Tick Charts
Tick charts provide real-time price action data by displaying trades sequentially, making them more effective for tape reading compared to traditional time-based chart reading.
Tape Reading vs Chart Reading Infographic