High liquidity in trading ensures smoother transactions and tighter bid-ask spreads, reducing costs and enabling swift market entry and exit. In contrast, high volatility increases price fluctuations, presenting both greater risk and opportunity for profit but often results in wider spreads and potential slippage. Balancing liquidity and volatility is crucial for traders aiming to optimize execution efficiency while managing exposure to market swings.
Table of Comparison
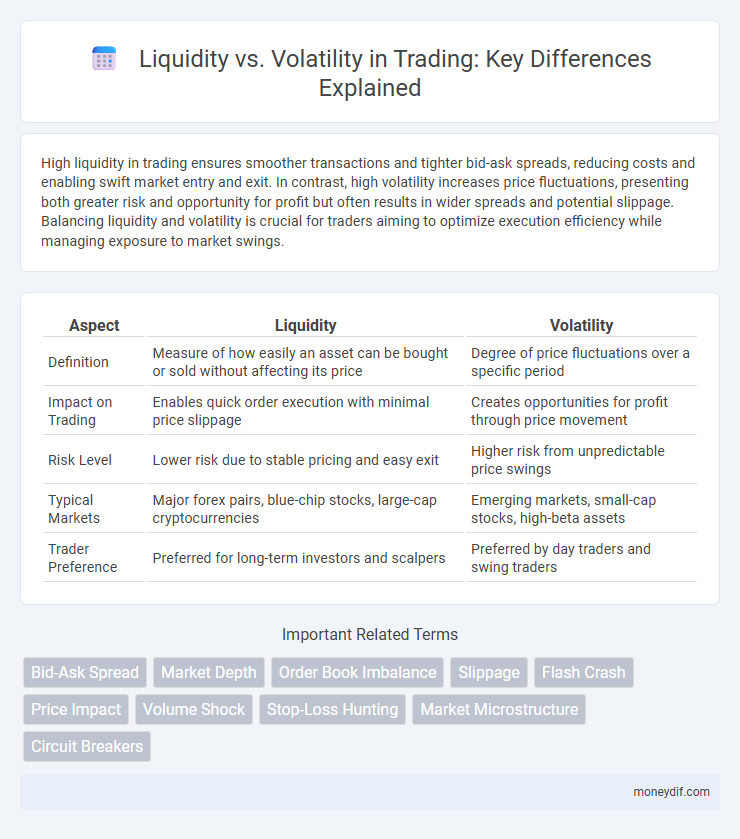
| Aspect | Liquidity | Volatility |
|---|---|---|
| Definition | Measure of how easily an asset can be bought or sold without affecting its price | Degree of price fluctuations over a specific period |
| Impact on Trading | Enables quick order execution with minimal price slippage | Creates opportunities for profit through price movement |
| Risk Level | Lower risk due to stable pricing and easy exit | Higher risk from unpredictable price swings |
| Typical Markets | Major forex pairs, blue-chip stocks, large-cap cryptocurrencies | Emerging markets, small-cap stocks, high-beta assets |
| Trader Preference | Preferred for long-term investors and scalpers | Preferred by day traders and swing traders |
Understanding Liquidity in Financial Markets
Liquidity in financial markets refers to the ease with which assets can be bought or sold without causing significant price changes, enabling efficient trade execution and reduced transaction costs. High liquidity typically results in tighter bid-ask spreads and greater market depth, facilitating smoother price discovery and minimizing slippage. Understanding liquidity is crucial for traders to manage risk and optimize entry and exit points in volatile market conditions.
Defining Volatility in Trading
Volatility in trading measures the degree of price fluctuations of a security over a specific period, indicating the level of risk and uncertainty in the market. High volatility often leads to larger price swings, attracting traders seeking profit opportunities but increasing exposure to potential losses. Understanding volatility through indicators such as the Average True Range (ATR) and Bollinger Bands is crucial for effective risk management and strategic decision-making.
Liquidity vs Volatility: Key Differences
Liquidity refers to the ease with which assets can be bought or sold in the market without causing significant price changes, while volatility measures the degree of price fluctuations over time. High liquidity typically results in lower bid-ask spreads and more stable prices, whereas high volatility indicates rapid and unpredictable price movements. Understanding the balance between liquidity and volatility is crucial for traders to optimize entry and exit points and manage risk effectively.
How Liquidity Impacts Trading Strategies
High liquidity in financial markets ensures tighter bid-ask spreads, enabling traders to execute large orders with minimal price slippage and reduced transaction costs. Low liquidity often leads to increased volatility and unpredictable price movements, which can disrupt algorithmic and high-frequency trading strategies designed for stable market conditions. Understanding liquidity levels allows traders to adjust their entry and exit points, optimize position sizing, and manage risk effectively in dynamic market environments.
Volatility’s Role in Price Movements
Volatility significantly influences price movements by indicating the degree of variation in trading prices over a given period, directly affecting market uncertainty and risk assessment. High volatility often leads to rapid price changes, creating opportunities for traders to capitalize on short-term fluctuations but also increasing potential losses. Understanding volatility patterns helps traders develop strategies to time entry and exit points more effectively, optimizing profit potential in dynamic markets.
Measuring Liquidity: Tools and Metrics
Measuring liquidity in trading involves key tools and metrics such as bid-ask spreads, order book depth, and trading volume, which collectively indicate how easily an asset can be bought or sold without impacting its price. The bid-ask spread reflects the cost of executing trades, narrower spreads signal higher liquidity, while order book depth shows the quantity of available orders at different price levels, offering insights into market resilience. Trading volume highlights the activity level of a security, with higher volumes generally associated with enhanced liquidity and reduced volatility risk.
Assessing Volatility: Common Indicators
Assessing volatility in trading relies on common indicators such as the Average True Range (ATR), Bollinger Bands, and the Volatility Index (VIX), which measure price fluctuations and market sentiment. Traders use ATR to determine the degree of price movement over a set period, while Bollinger Bands highlight periods of high or low volatility by illustrating standard deviations from a moving average. The VIX quantifies expected market volatility based on S&P 500 options, serving as a crucial gauge for risk assessment and liquidity planning.
The Relationship Between Liquidity and Volatility
Liquidity directly influences market volatility, as higher liquidity typically leads to narrower bid-ask spreads and smoother price movements, reducing volatility. In contrast, low liquidity markets experience larger price swings due to fewer participants and limited order depth, amplifying volatility. Understanding the dynamic interplay between liquidity and volatility is crucial for developing effective trading strategies and managing risk.
Managing Risks: Liquidity and Volatility Considerations
Effective risk management in trading requires balancing liquidity and volatility to minimize potential losses and capitalize on market opportunities. High liquidity ensures smoother trade execution and tighter spreads, reducing slippage risks during volatile conditions. Traders must monitor liquidity pools and volatility indices like the VIX to adjust position sizes and implement stop-loss orders accordingly.
Liquidity vs Volatility: Choosing the Right Market
Liquidity directly impacts price stability by enabling smoother transactions and tighter bid-ask spreads, while high volatility indicates rapid price changes that can increase trading risks. Markets with ample liquidity allow traders to enter and exit positions efficiently, reducing slippage and execution costs. Choosing the right market involves balancing liquidity for cost-effectiveness against volatility, which offers greater profit potential but requires robust risk management strategies.
Important Terms
Bid-Ask Spread
The bid-ask spread narrows in highly liquid markets where frequent trading reduces transaction costs, while volatile markets typically experience wider spreads due to increased uncertainty and risk. This spread directly reflects the balance between liquidity providers seeking profit and traders facing price fluctuations.
Market Depth
Market depth reflects the volume of buy and sell orders at various price levels, directly influencing liquidity by indicating the market's capacity to absorb large trades without significant price shifts. Higher market depth typically reduces volatility as abundant orders stabilize prices, while shallow depth can lead to increased price fluctuations due to limited cushioning against large transactions.
Order Book Imbalance
Order Book Imbalance measures the difference between buy and sell orders, providing insights into market liquidity and potential price movements. High imbalance often indicates low liquidity and increased volatility, signaling heightened risk for traders and potential rapid price shifts.
Slippage
Slippage occurs when the execution price of a trade differs from the expected price, often influenced by liquidity and market volatility; low liquidity can cause larger slippage due to insufficient orders at the desired price, while high volatility increases price fluctuations, exacerbating slippage risk. Traders must monitor order book depth and real-time volatility metrics to minimize slippage and optimize trade execution efficiency.
Flash Crash
The Flash Crash of May 6, 2010, exemplified how sudden liquidity withdrawal can trigger extreme market volatility, causing the Dow Jones Industrial Average to plunge about 1,000 points within minutes. High-frequency trading algorithms exacerbated the liquidity vacuum, amplifying price swings and disrupting normal market functioning.
Price Impact
Price impact refers to the change in asset price caused by executing a trade, directly influenced by liquidity and volatility levels. Higher liquidity typically reduces price impact by allowing larger trades with minimal price movement, whereas increased volatility amplifies price fluctuations, intensifying the price impact of transactions.
Volume Shock
Volume shock occurs when a sudden surge or drop in trading volume significantly impacts market liquidity, causing bid-ask spreads to widen and reducing the ability to execute large orders without price disruption. This volatility introduced by volume shock reflects a sharp imbalance between supply and demand, often resulting in increased price fluctuations and heightened market risk.
Stop-Loss Hunting
Stop-loss hunting exploits low liquidity periods by triggering clustered stop-loss orders, causing sharp price volatility spikes. Increased volatility from stop-loss hunting further reduces market liquidity, creating a feedback loop that intensifies price swings and market instability.
Market Microstructure
Market microstructure studies the mechanisms through which liquidity providers and traders interact, directly influencing price volatility in financial markets. Higher liquidity generally reduces bid-ask spreads and mitigates volatility, while lower liquidity can exacerbate price fluctuations due to limited market depth and increased order impact.
Circuit Breakers
Circuit breakers are essential mechanisms in financial markets designed to temporarily halt trading during extreme volatility to prevent liquidity dry-ups and stabilize prices. By pausing market activity, they help restore liquidity and alleviate panic-driven shocks, maintaining orderly trading conditions.
Liquidity vs Volatility Infographic