The yield curve represents the interest rates of government bonds across various maturities, reflecting market expectations for economic growth and inflation. The swap curve, derived from interest rate swaps, often serves as a benchmark for pricing corporate debt and managing interest rate risk. Comparing the two curves provides valuable insights into credit risk premiums and market liquidity conditions in the treasury market.
Table of Comparison
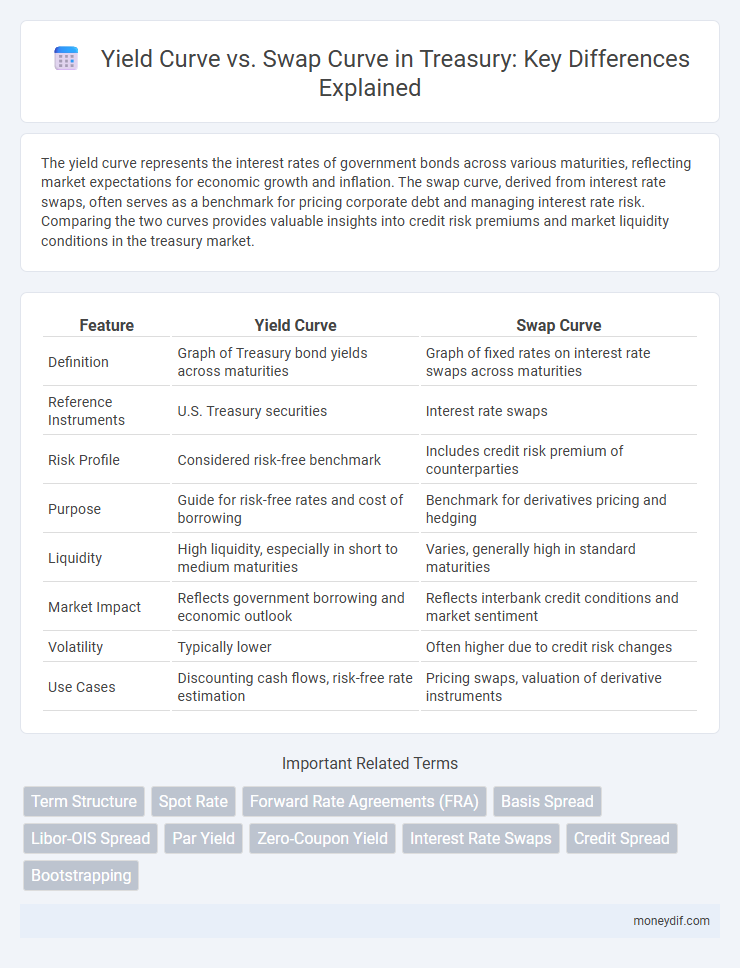
| Feature | Yield Curve | Swap Curve |
|---|---|---|
| Definition | Graph of Treasury bond yields across maturities | Graph of fixed rates on interest rate swaps across maturities |
| Reference Instruments | U.S. Treasury securities | Interest rate swaps |
| Risk Profile | Considered risk-free benchmark | Includes credit risk premium of counterparties |
| Purpose | Guide for risk-free rates and cost of borrowing | Benchmark for derivatives pricing and hedging |
| Liquidity | High liquidity, especially in short to medium maturities | Varies, generally high in standard maturities |
| Market Impact | Reflects government borrowing and economic outlook | Reflects interbank credit conditions and market sentiment |
| Volatility | Typically lower | Often higher due to credit risk changes |
| Use Cases | Discounting cash flows, risk-free rate estimation | Pricing swaps, valuation of derivative instruments |
Understanding the Yield Curve: An Overview
The yield curve represents the relationship between interest rates and the maturity of debt securities, typically government bonds, providing critical insights into market expectations for interest rates, inflation, and economic growth. In contrast, the swap curve reflects fixed rates on interest rate swaps across various maturities, often used by financial institutions to hedge interest rate risk or speculate on changes in yield spreads. Understanding the yield curve involves analyzing its shape--normal, inverted, or flat--which signals investor sentiment about future economic conditions and guides treasury decisions on borrowing and investment strategies.
What is a Swap Curve? Key Definitions
The swap curve represents the relationship between swap rates and their maturities, serving as a benchmark for fixed-rate borrowing costs in interest rate swaps. It reflects the market's expectations of future interest rates and credit risk, providing critical insight into yield spreads beyond government bond yields. Understanding swap curves is essential for pricing derivatives, managing interest rate risk, and assessing the cost of fixed-rate financing in Treasury management.
Construction of Yield Curve vs Swap Curve
The construction of the yield curve involves plotting the yields of government securities across various maturities to reflect risk-free interest rates, primarily derived from Treasury bonds and notes. In contrast, the swap curve is constructed using fixed rates from interest rate swap contracts, incorporating credit risk and liquidity premiums inherent in the interbank market. While the yield curve serves as the benchmark for risk-free rates, the swap curve provides a market-based measure for discounting cash flows and pricing derivative instruments.
Key Differences Between Yield Curve and Swap Curve
The yield curve represents government bond yields across various maturities, reflecting sovereign credit risk and monetary policy expectations. The swap curve, derived from interest rate swaps, incorporates market perceptions of credit risk among banks and liquidity premiums beyond government bonds. Key differences include the yield curve's focus on risk-free rates versus the swap curve's incorporation of counterparty risk and its role as a benchmark for corporate borrowing costs.
Factors Influencing Yield and Swap Curves
Interest rate expectations, inflation outlook, and credit risk significantly influence the shape of both yield and swap curves. Government bond supply and demand dynamics primarily impact the yield curve, while swap curves are more affected by credit risk perceptions and liquidity in the interbank market. Central bank policies and macroeconomic indicators also play crucial roles in driving curve shifts and steepness, reflecting market sentiment and economic forecasts.
Interpretations: What Curves Signal About Markets
The yield curve reflects government bond yields across maturities, signaling market expectations for interest rates, economic growth, and inflation. The swap curve, derived from interest rate swaps, incorporates credit risk and liquidity premiums, providing insights into banks' cost of funds and market risk sentiment. Divergences between the two curves often indicate shifts in risk appetite, market stress, or changing monetary policy outlooks.
Applications in Treasury Management
Yield curves and swap curves serve critical roles in treasury management by offering distinct benchmarks for interest rate risk assessment and hedging strategies. Yield curves, derived from government bonds, help treasurers evaluate credit risk and liquidity in sovereign debt, guiding decisions on bond issuance and investment timing. Swap curves, reflecting interbank lending rates, provide more accurate pricing for derivative contracts and enable effective management of interest rate exposure through swaps, enhancing cash flow predictability and portfolio optimization.
Risks and Limitations of Each Curve
The yield curve, derived from government securities, reflects interest rate expectations and credit risk-free benchmarks but is susceptible to distortions due to liquidity constraints and market segmentation. The swap curve, based on interest rate swap rates, incorporates counterparty credit risk and better captures market-implied funding costs, yet it can be influenced by credit risk premiums and less transparent pricing. Understanding the limitations of each curve is vital for accurate risk assessment, pricing derivatives, and making informed hedging decisions in treasury management.
Real-world Examples: Yield Curve and Swap Curve Analysis
The Treasury yield curve reflects actual government bond yields across maturities, serving as a benchmark for risk-free interest rates, while the swap curve represents fixed rates in interest rate swap agreements influenced by credit risk and liquidity conditions. In real-world scenarios, during periods of market stress such as the 2008 financial crisis, the swap curve often steepened relative to the Treasury yield curve due to heightened counterparty risk and demand for credit protection. Analysis of these curves enables treasury managers to optimize hedging strategies, assess interest rate risk, and gauge market sentiment on future economic conditions and monetary policy.
Strategic Implications for Treasury Professionals
Understanding the differences between the yield curve and swap curve is crucial for Treasury professionals to optimize interest rate risk management and funding strategies. The yield curve reflects government bond yields and serves as a benchmark for risk-free rates, while the swap curve incorporates credit risk and liquidity premiums, providing more accurate pricing for corporate hedging and funding instruments. Leveraging swap curves enables treasury teams to make informed decisions on debt issuance, asset-liability management, and derivative structuring, enhancing strategic financial planning and cost-efficiency.
Important Terms
Term Structure
The term structure reflects the relationship between interest rates and maturities, where the yield curve depicts government bond yields across different maturities and the swap curve represents fixed rates on interest rate swaps, both serving as key benchmarks in fixed income markets.
Spot Rate
The spot rate represents the yield on a zero-coupon bond for a specific maturity, directly reflecting the pure interest rate at that point on the yield curve. Comparing the yield curve, which shows government bond yields across maturities, to the swap curve, derived from interest rate swaps, reveals differences in credit risk, liquidity, and market expectations embedded in spot rates extracted from each curve.
Forward Rate Agreements (FRA)
Forward Rate Agreements (FRAs) are derivative contracts that allow parties to lock in interest rates for a future period, typically referencing the interbank lending market and closely tied to the yield curve's spot and forward rates. While the yield curve represents government bond yields across maturities, the swap curve reflects fixed rates in interest rate swaps, with FRA pricing often aligned more closely to the swap curve due to credit risk adjustments and liquidity differences between sovereign debt and interbank rates.
Basis Spread
Basis spread measures the difference between the yield curve and the swap curve, reflecting credit risk, liquidity, and market demand disparities between government bonds and interest rate swaps. A positive basis spread indicates higher yields on government bonds relative to swaps, often influenced by factors such as collateral quality and counterparty risk.
Libor-OIS Spread
The Libor-OIS spread measures credit risk and liquidity in the interbank market, impacting the divergence between the yield curve derived from government bonds and the swap curve used for interest rate derivatives pricing.
Par Yield
Par yield represents the coupon rate at which a bond's market price equals its face value, serving as a key indicator derived from the yield curve, which plots the interest rates of bonds with varying maturities. The swap curve, constructed from fixed-for-floating interest rate swaps, often differs from the government yield curve due to credit risk and liquidity premiums, making the comparison between par yields on these curves critical for accurate pricing and hedging strategies in fixed income markets.
Zero-Coupon Yield
Zero-coupon yield curves provide pure discount rates derived from government bonds, serving as a benchmark for comparing market-implied swap curves, which incorporate credit risk and liquidity premiums.
Interest Rate Swaps
Interest Rate Swaps are derivatives where parties exchange fixed and floating interest payments, with pricing heavily influenced by the swap curve, which represents fixed rates for swaps across maturities. The yield curve reflects the term structure of interest rates on government bonds, while the swap curve often trades at a spread above the yield curve, incorporating credit risk and liquidity premiums, making it a crucial benchmark for corporate borrowing costs and risk management.
Credit Spread
Credit spread represents the difference in yield between a corporate bond and a risk-free benchmark, often Treasury yields from the yield curve, reflecting default risk and liquidity premiums. Comparing credit spreads to swap curve spreads helps assess relative credit risk and market sentiment, as swaps incorporate counterparty risk and liquidity factors distinct from government bonds.
Bootstrapping
Bootstrapping constructs a zero-coupon yield curve by sequentially solving for spot rates from observed market prices of coupon-bearing bonds and swaps, enabling precise valuation of fixed income securities. The yield curve derived reflects government or benchmark bond yields, while the swap curve incorporates credit risk and liquidity premiums, often resulting in slightly higher swap rates used as reference for interest rate swaps pricing.
Yield Curve vs Swap Curve Infographic