Gross margin reflects the difference between sales revenue and the cost of goods sold, highlighting the profitability of core production activities. Contribution margin measures the amount remaining after variable costs are deducted from sales, indicating how much contributes to covering fixed costs and generating profit. Understanding the distinction between these margins aids in pricing decisions, cost control, and profitability analysis.
Table of Comparison
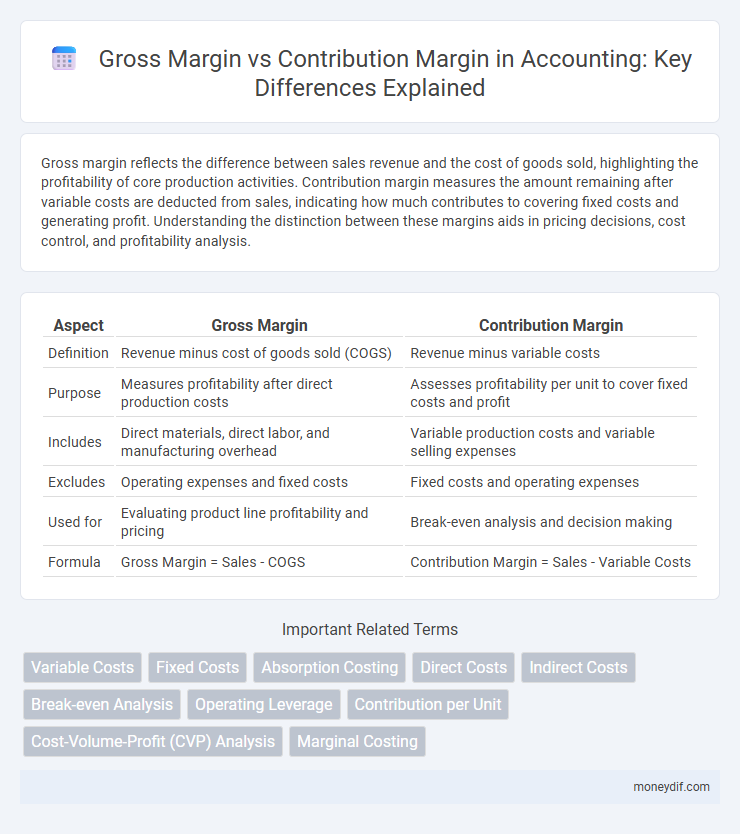
| Aspect | Gross Margin | Contribution Margin |
|---|---|---|
| Definition | Revenue minus cost of goods sold (COGS) | Revenue minus variable costs |
| Purpose | Measures profitability after direct production costs | Assesses profitability per unit to cover fixed costs and profit |
| Includes | Direct materials, direct labor, and manufacturing overhead | Variable production costs and variable selling expenses |
| Excludes | Operating expenses and fixed costs | Fixed costs and operating expenses |
| Used for | Evaluating product line profitability and pricing | Break-even analysis and decision making |
| Formula | Gross Margin = Sales - COGS | Contribution Margin = Sales - Variable Costs |
Introduction to Gross Margin and Contribution Margin
Gross margin represents the percentage of revenue remaining after deducting the cost of goods sold (COGS), highlighting the efficiency of production and pricing strategies. Contribution margin indicates the amount per unit that contributes to covering fixed costs and generating profit, calculated as sales revenue minus variable costs. Understanding the distinction between gross margin and contribution margin enables businesses to analyze product profitability and cost behavior for strategic decision-making.
Defining Gross Margin: Key Concepts
Gross margin represents the difference between net sales revenue and the cost of goods sold (COGS), reflecting the profitability from core production activities before operating expenses. It highlights the percentage of sales retained to cover operating costs and generate profit, calculated as (Net Sales - COGS) / Net Sales. Understanding gross margin is essential for assessing product pricing, production efficiency, and overall financial health within accounting practices.
Understanding Contribution Margin: An Overview
Contribution margin represents the amount remaining from sales revenue after variable costs are deducted, highlighting the funds available to cover fixed expenses and generate profit. Unlike gross margin, which subtracts the cost of goods sold to measure overall production profitability, contribution margin focuses specifically on variable costs linked to production and sales volume. This metric is essential for break-even analysis, pricing decisions, and identifying the impact of sales volume changes on profitability.
Core Differences Between Gross Margin and Contribution Margin
Gross margin calculates profitability by subtracting the cost of goods sold (COGS) from total revenue, highlighting how efficiently a company produces its products. Contribution margin, on the other hand, deducts all variable costs, including direct materials, labor, and variable overhead, from sales, emphasizing the amount available to cover fixed costs and generate profit. The core difference lies in gross margin focusing on production costs while contribution margin evaluates the impact of variable costs on overall profitability.
Calculating Gross Margin: Step-by-Step Guide
Calculating gross margin involves subtracting the cost of goods sold (COGS) from total revenue and then dividing the result by total revenue to express it as a percentage. This metric highlights the percentage of revenue that exceeds the direct costs associated with producing goods, reflecting the core profitability before operating expenses. Accurate gross margin calculation assists businesses in assessing product pricing strategies and cost control efficiency, which differ significantly from contribution margin that focuses on variable costs and contribution toward fixed expenses.
How to Compute Contribution Margin
Contribution margin is computed by subtracting variable costs directly associated with producing goods or services from total sales revenue. This calculation isolates the amount available to cover fixed costs and generate profit, offering insight into product profitability. The formula is expressed as Contribution Margin = Sales Revenue - Variable Costs, enabling businesses to assess cost behavior and pricing strategies effectively.
Importance of Gross Margin in Financial Analysis
Gross margin measures the profitability of a company's core activities by subtracting the cost of goods sold from total revenue, providing insight into production efficiency and pricing strategies. It is critical for financial analysis as it highlights the ability to cover operating expenses and generate profit before accounting for overhead and fixed costs. Investors and managers rely on gross margin to assess business viability and make informed decisions on cost control and revenue enhancement.
Strategic Uses of Contribution Margin in Decision-Making
Contribution margin provides critical insights for strategic decision-making by highlighting the profitability of individual products and services after variable costs are deducted. Unlike gross margin, which assesses overall profitability, contribution margin enables managers to evaluate the impact of fixed costs and guide pricing, product mix, and cost-control strategies. This metric supports break-even analysis, margin of safety calculations, and optimization of resource allocation to maximize overall company profits.
Gross Margin vs Contribution Margin: Which Metric to Prioritize?
Gross margin measures the percentage of revenue remaining after deducting the cost of goods sold, highlighting overall profitability from core operations. Contribution margin, calculated by subtracting variable costs from sales, provides insight into how much revenue contributes to covering fixed costs and generating profit. Prioritizing contribution margin is essential for decision-making in pricing, product selection, and cost control, while gross margin offers a broader view of financial health.
Common Mistakes When Interpreting Margins
Common mistakes when interpreting gross margin and contribution margin include confusing fixed and variable costs, leading to inaccurate profitability analysis. Gross margin excludes variable costs but includes fixed costs, while contribution margin isolates variable costs to assess how sales cover fixed expenses. Misapplying either margin can result in poor pricing decisions and ineffective cost control strategies.
Important Terms
Variable Costs
Variable costs directly reduce contribution margin while gross margin includes both variable and fixed costs, making contribution margin a more precise metric for assessing cost behavior and profitability.
Fixed Costs
Fixed costs remain constant regardless of sales volume and directly impact the difference between gross margin, which subtracts only variable costs from revenue, and contribution margin, which subtracts variable costs to assess profitability for covering fixed costs.
Absorption Costing
Absorption costing allocates fixed manufacturing overhead to product costs, resulting in a gross margin that includes fixed overhead, whereas contribution margin focuses on variable costs and highlights the profitability of individual products by excluding fixed overhead.
Direct Costs
Direct costs, such as raw materials and labor, are crucial in calculating both gross margin and contribution margin, where gross margin subtracts these direct costs from revenue to highlight product profitability, while contribution margin deducts variable direct costs to assess the financial contribution toward fixed costs and profit. Understanding the impact of direct costs on these margins helps businesses optimize pricing strategies and cost control for improved overall profitability.
Indirect Costs
Indirect costs reduce the contribution margin but are excluded from gross margin calculations, as gross margin accounts only for direct costs associated with production.
Break-even Analysis
Break-even analysis calculates the sales volume at which total revenue equals total costs by comparing gross margin, which includes fixed and variable expenses, to contribution margin, which isolates variable costs to assess profitability per unit.
Operating Leverage
Operating leverage measures the sensitivity of a company's operating income to changes in sales volume, heavily influenced by the relationship between gross margin and contribution margin. Higher contribution margin relative to gross margin indicates greater fixed costs and stronger operating leverage, which amplifies profit variability with sales fluctuations.
Contribution per Unit
Contribution per Unit measures the profit generated per product after variable costs, directly impacting contribution margin, which differs from gross margin by excluding fixed costs and focusing solely on variable expenses.
Cost-Volume-Profit (CVP) Analysis
Contribution margin directly reflects the amount available to cover fixed costs and generate profit, making it more relevant than gross margin for Cost-Volume-Profit (CVP) analysis.
Marginal Costing
Marginal costing focuses on contribution margin, which excludes fixed overheads, unlike gross margin that includes total sales revenue minus cost of goods sold.
gross margin vs contribution margin Infographic