Alpha represents the excess return of an investment relative to the market benchmark, indicating the manager's ability to generate value beyond market movements. Beta measures the sensitivity of an investment's returns to market fluctuations, reflecting its systematic risk level. Understanding the distinction between alpha and beta helps investors evaluate performance and manage portfolio risk effectively.
Table of Comparison
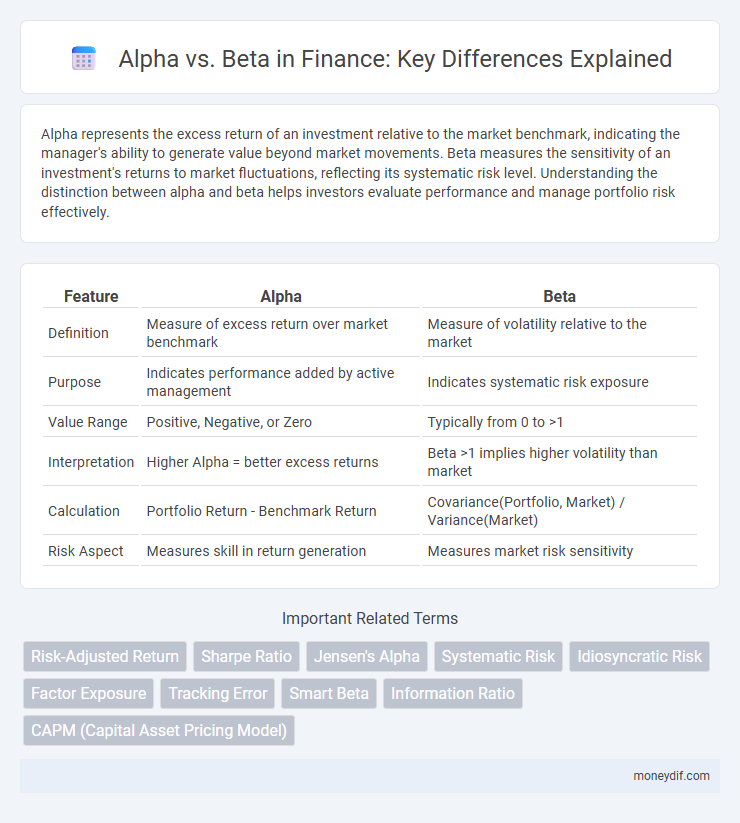
| Feature | Alpha | Beta |
|---|---|---|
| Definition | Measure of excess return over market benchmark | Measure of volatility relative to the market |
| Purpose | Indicates performance added by active management | Indicates systematic risk exposure |
| Value Range | Positive, Negative, or Zero | Typically from 0 to >1 |
| Interpretation | Higher Alpha = better excess returns | Beta >1 implies higher volatility than market |
| Calculation | Portfolio Return - Benchmark Return | Covariance(Portfolio, Market) / Variance(Market) |
| Risk Aspect | Measures skill in return generation | Measures market risk sensitivity |
Understanding Alpha and Beta in Finance
Alpha represents the excess return of an investment relative to the return of a benchmark index, serving as a key indicator of an asset manager's skill in generating above-market gains. Beta measures the sensitivity of an investment's returns to market fluctuations, quantifying systematic risk by comparing price movements to an overall market index. Understanding Alpha and Beta enables investors to evaluate performance and risk, optimizing portfolio allocation and achieving tailored investment strategies.
Defining Alpha: Measuring Active Investment Returns
Alpha measures an investment's active returns compared to a benchmark index, representing the value a portfolio manager adds beyond market performance. It quantifies the excess return achieved through stock selection, market timing, or other active management strategies, isolated from market risk. Positive alpha indicates outperformance relative to the expected return based on beta, while negative alpha suggests underperformance.
Defining Beta: Assessing Market Risk Exposure
Beta measures a stock's volatility relative to the overall market, indicating its sensitivity to systematic risk. A beta greater than 1 suggests the asset is more volatile than the market, while a beta less than 1 indicates lower volatility. Investors use beta to assess market risk exposure and to construct portfolios aligned with their risk tolerance and return expectations.
Alpha vs Beta: Key Differences Explained
Alpha measures an investment's ability to outperform its benchmark, representing excess returns generated by active management, while Beta indicates the asset's sensitivity to market movements, reflecting systematic risk. High Alpha signifies superior risk-adjusted performance, whereas Beta values greater than one imply higher volatility than the market. Understanding the balance between Alpha and Beta helps investors optimize portfolio returns and manage risk exposure effectively.
The Importance of Alpha in Portfolio Performance
Alpha measures the excess return of a portfolio relative to its benchmark, indicating the manager's skill in generating value beyond market movements. While beta reflects the sensitivity to market risk, alpha quantifies the true added performance independent of market fluctuations. Consistently achieving positive alpha is crucial for investors seeking superior risk-adjusted returns and portfolio outperformance.
The Role of Beta in Risk Management
Beta measures an asset's sensitivity to market movements, playing a crucial role in risk management by quantifying systematic risk. Investors use beta to assess portfolio volatility relative to the overall market, allowing for informed diversification strategies. A higher beta indicates greater market risk exposure, while a lower beta suggests more stability in fluctuating economic conditions.
How to Calculate Alpha and Beta
Alpha is calculated by subtracting the expected return predicted by the Capital Asset Pricing Model (CAPM) from the actual return of an investment, using the formula Alpha = Actual Return - [Risk-Free Rate + Beta x (Market Return - Risk-Free Rate)]. Beta is determined by measuring the covariance between the investment's returns and the market's returns, divided by the variance of the market's returns, represented as Beta = Covariance(Investment, Market) / Variance(Market). These calculations enable investors to assess performance relative to market risk and identify whether an asset is outperforming or underperforming expectations.
Practical Examples: Alpha and Beta in Action
Alpha measures an investment's performance relative to a market benchmark, indicating the value a portfolio manager adds beyond passive index returns. For example, a mutual fund generating a 12% return when its benchmark rises by 8% has an alpha of 4%, showcasing superior stock-picking skills. Beta, on the other hand, quantifies an asset's sensitivity to market movements; a beta of 1.2 suggests the investment is 20% more volatile than the market, making it crucial for risk management in portfolio construction.
Limitations of Relying on Alpha and Beta
Alpha and Beta metrics, while essential for evaluating investment performance and risk, have inherent limitations that can skew decision-making. Alpha may not fully capture systematic risks or market anomalies, and its historical reliance can mislead investors about future returns. Beta assumes constant volatility and correlation with the market, ignoring changing market dynamics and asset-specific risks, which can result in inaccurate risk assessments.
Integrating Alpha and Beta into Investment Strategies
Integrating alpha and beta into investment strategies enhances portfolio performance by balancing market risk and generating excess returns. Alpha represents the value added by active management through skillful security selection, while beta measures systematic market risk that captures broad market movements. Combining these factors enables investors to optimize risk-adjusted returns by aligning market exposure with targeted active alpha generation.
Important Terms
Risk-Adjusted Return
Risk-adjusted return measures investment performance by comparing alpha, which represents excess returns beyond market expectations, against beta, indicating the investment's sensitivity to market movements.
Sharpe Ratio
The Sharpe Ratio measures risk-adjusted return by comparing portfolio excess returns to its volatility, highlighting how Alpha represents excess return beyond Beta-driven market risk.
Jensen's Alpha
Jensen's Alpha measures a portfolio's excess return relative to its expected return based on Beta, indicating risk-adjusted performance beyond market movements.
Systematic Risk
Systematic risk, measured by beta, represents market-related volatility that cannot be diversified away, whereas alpha quantifies the excess return an investment generates beyond the expected return based on its beta.
Idiosyncratic Risk
Idiosyncratic risk refers to the asset-specific risk that impacts alpha by representing returns unexplained by beta, which measures systematic market risk exposure.
Factor Exposure
Factor exposure quantifies a portfolio's sensitivity to underlying systematic risks, distinguishing alpha's unique active returns from beta's market-driven performance.
Tracking Error
Tracking error quantifies the deviation of a portfolio's returns from its benchmark, directly impacting the relationship between generated alpha and beta exposure.
Smart Beta
Smart Beta strategies seek to systematically capture Alpha by optimizing factor exposure while maintaining controlled Beta risk.
Information Ratio
Information Ratio measures the excess return (Alpha) of an investment relative to its tracking error, highlighting risk-adjusted performance beyond Beta's market-related volatility.
CAPM (Capital Asset Pricing Model)
The Capital Asset Pricing Model (CAPM) quantifies expected investment returns by assessing Beta as market risk sensitivity, while Alpha measures performance deviation from CAPM's predicted return.
Alpha vs Beta Infographic