Fundamental analysis evaluates a company's intrinsic value by examining financial statements, industry trends, and economic indicators, providing long-term investment insights. Technical analysis uses historical price data and chart patterns to predict short-term market movements and identify trading opportunities. Combining both approaches can enhance decision-making by balancing market sentiment with underlying business health.
Table of Comparison
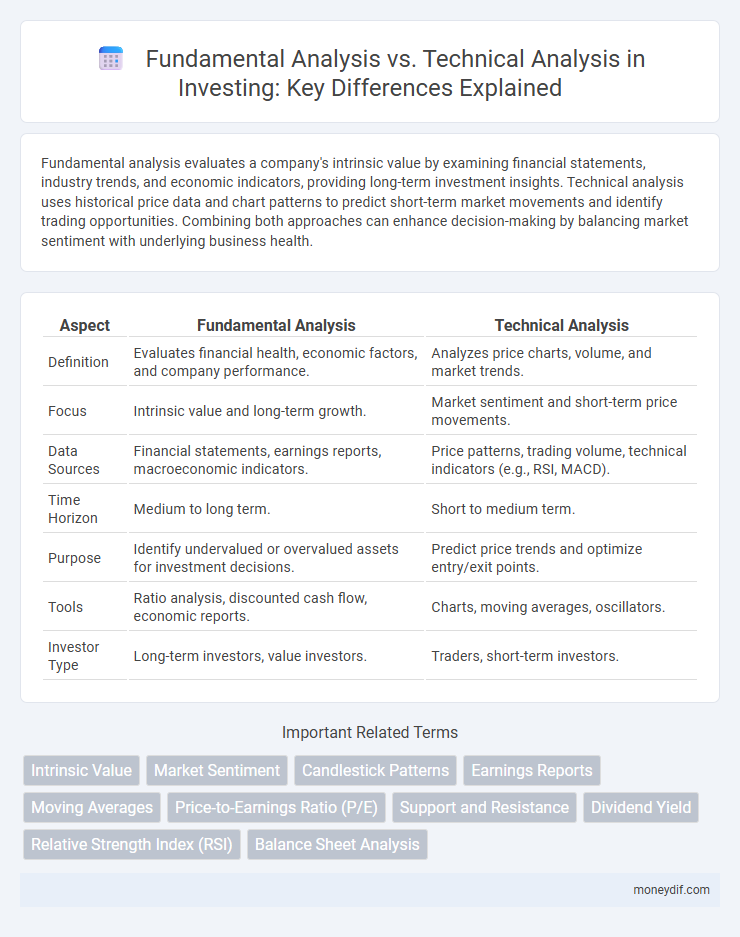
| Aspect | Fundamental Analysis | Technical Analysis |
|---|---|---|
| Definition | Evaluates financial health, economic factors, and company performance. | Analyzes price charts, volume, and market trends. |
| Focus | Intrinsic value and long-term growth. | Market sentiment and short-term price movements. |
| Data Sources | Financial statements, earnings reports, macroeconomic indicators. | Price patterns, trading volume, technical indicators (e.g., RSI, MACD). |
| Time Horizon | Medium to long term. | Short to medium term. |
| Purpose | Identify undervalued or overvalued assets for investment decisions. | Predict price trends and optimize entry/exit points. |
| Tools | Ratio analysis, discounted cash flow, economic reports. | Charts, moving averages, oscillators. |
| Investor Type | Long-term investors, value investors. | Traders, short-term investors. |
Introduction to Investment Analysis
Fundamental analysis evaluates a company's intrinsic value by examining financial statements, economic indicators, and industry conditions to guide long-term investment decisions. Technical analysis involves studying historical price charts, trading volumes, and market trends to predict short-term price movements. Combining both methods enhances investor ability to assess risks and identify optimal entry and exit points in various market conditions.
Defining Fundamental Analysis
Fundamental analysis evaluates a company's intrinsic value by examining financial statements, industry conditions, and economic indicators to forecast its long-term performance. Key metrics include earnings per share (EPS), price-to-earnings (P/E) ratio, revenue growth, and debt levels, which help investors identify undervalued stocks. This approach contrasts with technical analysis, as it emphasizes underlying business health rather than past price movements.
Understanding Technical Analysis
Technical analysis involves studying historical price charts and market data to forecast future price movements, emphasizing patterns such as trends, support, and resistance levels. This method relies on indicators like moving averages, Relative Strength Index (RSI), and Bollinger Bands to identify entry and exit points for trades. It contrasts with fundamental analysis by focusing solely on market behavior rather than underlying financial health or economic factors.
Key Differences: Fundamental vs Technical
Fundamental analysis evaluates an asset's intrinsic value by examining financial statements, economic indicators, and industry conditions, while technical analysis focuses on price patterns, volume, and market trends to predict future movements. Fundamental analysis suits long-term investment strategies by assessing company performance and growth potential, whereas technical analysis caters to short-term trading decisions using charting tools and market sentiment. Investors often combine both approaches to optimize portfolio performance and risk management.
Core Tools in Fundamental Analysis
Fundamental analysis relies on core tools such as financial statements, including balance sheets, income statements, and cash flow statements, to evaluate a company's intrinsic value. Key metrics like earnings per share (EPS), price-to-earnings (P/E) ratio, and return on equity (ROE) provide insights into profitability, efficiency, and growth potential. This approach emphasizes macroeconomic factors, industry trends, and management quality to inform long-term investment decisions.
Essential Indicators in Technical Analysis
Essential indicators in technical analysis include moving averages, Relative Strength Index (RSI), and Bollinger Bands, which help investors identify market trends, momentum, and volatility. Moving averages smooth price data to reveal trends, while RSI measures overbought or oversold conditions, signaling potential reversals. Bollinger Bands use standard deviations to define price volatility, aiding traders in detecting breakout opportunities and price corrections.
Advantages of Fundamental Analysis
Fundamental analysis provides a comprehensive evaluation of a company's intrinsic value by examining financial statements, economic conditions, and industry trends, enabling investors to make informed long-term investment decisions. It identifies undervalued stocks by assessing earnings growth, debt levels, and cash flow stability, which are critical for sustainable investment performance. This approach reduces reliance on market volatility and short-term price fluctuations, offering a strategic advantage in portfolio management and risk assessment.
Benefits of Technical Analysis
Technical analysis offers investors precise entry and exit signals by analyzing historical price patterns and trading volumes, enabling timely decision-making. Its ability to identify market trends and momentum provides a practical edge in short-term trading and risk management. Furthermore, technical indicators such as moving averages and Relative Strength Index (RSI) help forecast price reversals and validate trend strength, enhancing portfolio performance.
When to Use Each Approach
Fundamental analysis is most effective for long-term investment decisions, focusing on a company's financial health, earnings, and market position to determine intrinsic value. Technical analysis is suited for short-term trading, using price charts and volume patterns to identify market trends and entry or exit points. Investors use fundamental analysis when assessing stock potential and technical analysis to time trades based on market momentum.
Combining Fundamental and Technical Strategies
Combining fundamental and technical analysis enhances investment decision-making by leveraging the strengths of both approaches: fundamental analysis assesses a company's intrinsic value through financial metrics and economic indicators, while technical analysis examines price patterns and market trends to time entries and exits. Integrating these strategies enables investors to identify undervalued assets with strong growth potential and optimize trade execution by interpreting market momentum and sentiment. This dual approach maximizes portfolio returns and minimizes risks by providing a comprehensive view of the investment landscape.
Important Terms
Intrinsic Value
Intrinsic value represents the true worth of an asset based on its fundamental factors such as earnings, dividends, and growth potential, making it a core concept in fundamental analysis. Technical analysis, in contrast, focuses on price movements and trading volumes without directly assessing intrinsic value, relying instead on historical market data and chart patterns.
Market Sentiment
Market sentiment reflects investor emotions and psychological factors influencing price movements, often assessed through technical analysis tools like charts and indicators. Fundamental analysis evaluates intrinsic value based on financial statements, economic data, and company performance, providing a long-term perspective that can influence sentiment-driven trading decisions.
Candlestick Patterns
Candlestick patterns provide visual insights into market sentiment and price action, making them essential tools within technical analysis for predicting future price movements. While fundamental analysis evaluates a security's intrinsic value through financial statements and economic indicators, candlestick patterns complement this by offering short-term timing signals based on historical price behavior.
Earnings Reports
Earnings reports provide critical fundamental data such as revenue, net income, and earnings per share, essential for evaluating a company's financial health and intrinsic value in fundamental analysis. Technical analysis, by contrast, examines price movements and trading volumes influenced by market reactions to these earnings reports, using patterns and indicators to forecast future stock price trends.
Moving Averages
Moving averages are primarily utilized in technical analysis to identify price trends and smooth out market volatility, whereas fundamental analysis focuses on evaluating a company's intrinsic value through financial statements, earnings reports, and economic indicators. Investors often combine moving averages with fundamental data to time entry and exit points more effectively in trading decisions.
Price-to-Earnings Ratio (P/E)
The Price-to-Earnings Ratio (P/E) serves as a crucial metric in fundamental analysis, offering insights into a company's valuation by comparing its current share price to its earnings per share, which helps investors assess whether a stock is overvalued or undervalued. In contrast, technical analysis focuses on price movements and trading volumes rather than financial metrics like P/E, relying on chart patterns and indicators to predict future stock behavior.
Support and Resistance
Support and resistance levels in technical analysis are price points where markets tend to reverse or pause, identified through historical price data and trading volume patterns. Fundamental analysis indirectly influences these levels by assessing underlying economic factors, corporate earnings, and market sentiment that drive supply and demand, ultimately affecting price behavior within those support and resistance zones.
Dividend Yield
Dividend yield serves as a key metric in fundamental analysis, reflecting a company's ability to generate income relative to its stock price, thereby helping investors assess long-term value and income potential. In contrast, technical analysis typically focuses on price movements and volume trends, placing less emphasis on dividend yield as it does not directly influence short-term market timing or trading signals.
Relative Strength Index (RSI)
Relative Strength Index (RSI) measures price momentum to identify overbought or oversold conditions, making it a key tool in Technical Analysis for timing market entries and exits. Unlike Fundamental Analysis, which evaluates intrinsic value through financial metrics, RSI focuses solely on price action and market sentiment without considering underlying assets' economic factors.
Balance Sheet Analysis
Balance sheet analysis in fundamental analysis focuses on evaluating a company's financial health through key metrics such as assets, liabilities, equity, liquidity ratios, and solvency ratios to assess intrinsic value and credit risk. Unlike technical analysis, which relies on price movements and trading volumes, balance sheet analysis provides insight into long-term financial stability and operational efficiency by examining tangible financial data.
Fundamental Analysis vs Technical Analysis Infographic