Overbought conditions occur when an asset's price has risen excessively, signaling a potential reversal or correction, while oversold conditions indicate that the price has dropped too far, suggesting a possible rebound. Traders use indicators like the Relative Strength Index (RSI) to identify these states and make informed decisions about entry and exit points. Recognizing overbought and oversold levels helps optimize trading strategies by minimizing risks and maximizing profit potential.
Table of Comparison
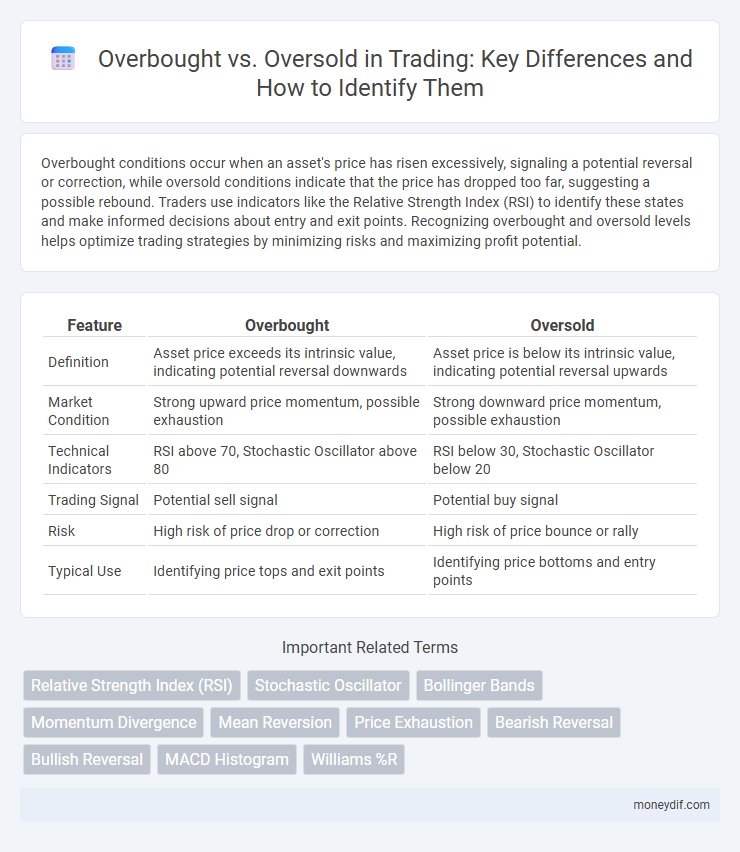
| Feature | Overbought | Oversold |
|---|---|---|
| Definition | Asset price exceeds its intrinsic value, indicating potential reversal downwards | Asset price is below its intrinsic value, indicating potential reversal upwards |
| Market Condition | Strong upward price momentum, possible exhaustion | Strong downward price momentum, possible exhaustion |
| Technical Indicators | RSI above 70, Stochastic Oscillator above 80 | RSI below 30, Stochastic Oscillator below 20 |
| Trading Signal | Potential sell signal | Potential buy signal |
| Risk | High risk of price drop or correction | High risk of price bounce or rally |
| Typical Use | Identifying price tops and exit points | Identifying price bottoms and entry points |
Understanding Overbought and Oversold Conditions
Overbought and oversold conditions in trading indicate potential market reversals, with overbought suggesting prices have risen excessively and may soon decline, while oversold signals prices have dropped sharply and might rebound. Technical indicators like the Relative Strength Index (RSI) and Stochastic Oscillator help identify these states by measuring momentum and price levels relative to historical ranges. Recognizing these conditions allows traders to make informed decisions on entry and exit points, reducing risk and maximizing profit potential.
Key Indicators to Identify Overbought and Oversold Markets
Key indicators to identify overbought and oversold markets include the Relative Strength Index (RSI), Stochastic Oscillator, and Moving Average Convergence Divergence (MACD). An RSI value above 70 typically signals overbought conditions, while below 30 indicates oversold levels. The Stochastic Oscillator provides momentum insights by comparing closing prices to price ranges, with readings above 80 suggesting overbought and below 20 signaling oversold markets.
The Role of RSI in Spotting Market Extremes
The Relative Strength Index (RSI) serves as a pivotal tool in identifying overbought and oversold conditions in trading, signaling potential market reversals. RSI values above 70 typically indicate overbought assets prone to price corrections, while readings below 30 suggest oversold conditions, often preceding upward price movements. Traders leverage RSI as a momentum oscillator to gauge market extremes and optimize entry and exit points effectively.
Stochastic Oscillator: Detecting Trend Reversals
The Stochastic Oscillator is a crucial momentum indicator used in trading to identify overbought and oversold conditions, signaling potential trend reversals. Values above 80 typically indicate overbought levels, suggesting a possible price decline, while values below 20 indicate oversold conditions, implying a potential price increase. Traders rely on the oscillator's crossovers and divergence from price action to confirm entry or exit points in volatile markets.
Interpreting Overbought and Oversold Signals
Overbought signals indicate that an asset's price has increased rapidly and may be due for a correction, suggesting potential selling pressure. Conversely, oversold signals reveal that an asset has experienced significant price declines, potentially signaling a buying opportunity as the market may rebound. Traders often rely on technical indicators like RSI and Stochastic Oscillator to accurately interpret these conditions and make informed decisions.
False Signals: Avoiding Common Pitfalls
False signals in overbought and oversold conditions often stem from relying solely on RSI or Stochastic indicators without confirming trends through volume or price action analysis. Traders must integrate multiple technical tools and consider market context to distinguish between genuine reversals and temporary price spikes. Ignoring these factors can lead to premature entries or exits, increasing the risk of losses in volatile trading environments.
Overbought vs Oversold in Different Asset Classes
Overbought and oversold conditions vary significantly across asset classes such as stocks, forex, and commodities, influenced by unique market dynamics and liquidity levels. In equities, overbought signals often arise from excessive buying near resistance levels, while in forex, currency pairs may become oversold due to macroeconomic shifts or central bank interventions. Commodity markets display pronounced overbought or oversold states during supply shocks or seasonal demand changes, necessitating tailored analysis for each asset class to optimize trading strategies.
Incorporating Volume Analysis with Overbought/Oversold Indicators
Incorporating volume analysis with overbought and oversold indicators enhances trading precision by validating price momentum and potential reversals. High volume during overbought conditions can signal a strong bullish trend, whereas elevated volume in oversold zones may indicate imminent price recovery. Combining volume metrics with Relative Strength Index (RSI) or Stochastic Oscillator readings provides traders with a more comprehensive market sentiment assessment.
Practical Strategies for Trading Market Extremes
Traders use overbought and oversold indicators like RSI and Stochastic Oscillator to identify potential market reversals and capitalize on extreme price conditions. Implementing practical strategies such as waiting for confirmation signals, combining multiple indicators, and setting precise entry and exit points helps manage risk effectively during market extremes. Consistent monitoring of volume trends alongside price action enhances the reliability of overbought and oversold signals for profitable trades.
Risk Management When Trading Overbought and Oversold Conditions
Trading in overbought and oversold conditions requires rigorous risk management to prevent significant losses caused by false signals and market reversals. Utilizing stop-loss orders, position sizing, and diversification helps mitigate risks associated with high volatility in these extremes. Traders should confirm overbought and oversold signals with additional indicators like RSI, MACD, or volume trends to enhance decision accuracy and protect capital.
Important Terms
Relative Strength Index (RSI)
The Relative Strength Index (RSI) is a momentum oscillator measuring price changes to identify overbought conditions above 70 and oversold conditions below 30 in financial markets.
Stochastic Oscillator
The Stochastic Oscillator identifies overbought conditions above 80 and oversold conditions below 20, signaling potential reversal points in asset price trends.
Bollinger Bands
Bollinger Bands indicate overbought conditions when prices consistently touch the upper band and oversold conditions when they repeatedly reach the lower band.
Momentum Divergence
Momentum divergence occurs when price trends show overbought or oversold conditions but momentum indicators like RSI or MACD reveal weakening trends, signaling potential reversals.
Mean Reversion
Mean reversion indicates that overbought assets typically experience price declines while oversold assets tend to rebound toward their historical average.
Price Exhaustion
Price exhaustion occurs when an asset's price reverses after a strong trend due to overbought or oversold conditions, indicating that buyers or sellers have depleted momentum. Overbought signals suggest excessive buying pressure and potential reversal, while oversold conditions imply excessive selling, both critical for identifying price exhaustion in financial markets.
Bearish Reversal
Bearish reversal signals often emerge when an asset shifts from overbought conditions above the RSI threshold of 70 toward oversold levels below 30, indicating a potential price decline.
Bullish Reversal
A bullish reversal often occurs when an asset transitions from oversold conditions, typically indicated by an RSI below 30, signaling potential upward momentum after a period of excessive selling.
MACD Histogram
The MACD Histogram indicates momentum shifts by displaying the difference between the MACD line and its signal line, where rising bars suggest oversold conditions transitioning to bullish momentum and falling bars indicate overbought conditions signaling potential bearish reversals.
Williams %R
Williams %R measures overbought and oversold conditions by comparing the current closing price to the highest high over a specified period, typically 14 days, with values ranging from 0 to -100. Readings above -20 indicate overbought conditions signaling potential price reversals downward, while readings below -80 suggest oversold conditions, hinting at potential upward price corrections.
Overbought vs Oversold Infographic